











Updated October 20, 2026
TL;DR: There’s no reliable single number for the cost of a bad hire, so you need to calculate your own. Add the direct costs you can pull from your accounting system (recruiting spend, salary and benefits paid, onboarding, severance, and replacement recruiting) to the hidden costs you have to estimate (manager and team time, vacancy, customer impact, and follow-on attrition). Label every estimate so the figure holds up in a finance review. The interview process is the lever TA controls directly: structured interviews predict job performance better than unstructured ones, and evidence-based debriefs make it harder for a mis-hire to get through.
When a hire who looked strong in the interview process leaves by month six, someone in leadership may want to know what it cost. The most credible answer is built from your own numbers: what you spent to recruit the person, what you paid them, and how long the role sat empty. This article gives you the formula, the benchmarks, an example you can copy, and the interview changes that lower the odds of making bad hires.
What a bad hire costs
Define a bad hire
A bad hire is someone whose skills, behavior, or fit with the role fall short of what the hiring process predicted, to the point that the business has to replace them or put them on formal performance management. The cost goes well beyond salary. It splits into two layers: direct costs you can pull from your accounting system, and hidden costs you have to estimate.
Use benchmarks to frame the range
Industry benchmarks give you a range for business case modeling. Gallup puts the cost of replacing an individual employee at one-half to two times their annual salary, and calls that a conservative estimate. A bad hire’s total cost sits on top of that range, because it also includes the original hire’s recruiting, salary, and exit costs.
Your costs will vary by region, whether you include overhead in salary calculations, and whether you use fixed-dollar or percentage-based estimates. That’s why published benchmarks give a range rather than a single number.
Why a bad hire who stays can cost more than one who leaves
A bad hire who leaves after six months costs the vacancy period plus the full replacement cycle. A bad hire who stays for 18 months costs underperformance the entire time, which can be worse because the cost has no clear end date. Team leads spend extra hours managing performance issues, colleagues absorb additional work, and projects slip.
Calculate the cost of a bad hire
Before you walk into a budget conversation, break the cost of a bad hire into components finance can follow. The table covers every direct and hidden cost category, with example figures for a mid-level role at a $120,000 base salary.
| Cost category | What it includes | Example ($120k role) |
|---|---|---|
| Recruiting spend | Agency fees, job boards, recruiter time, assessments | $18,000 (assuming a 15% agency fee) |
| Salary and benefits | Total compensation paid during tenure | $84,000 (6 months at 1.4x) |
| Onboarding and training | Manager time, formal programs, equipment | $15,000 |
| Severance and exit | Severance, PTO payout, COBRA, exit process | $16,000 |
| Replacement recruiting | The full recruiting cycle, repeated | $18,000 |
| Lost productivity | Ramp-up underperformance, output gap | Counted in salary in this example |
| Manager and team time | Performance management, coaching, workload redistribution | $25,000 |
| Vacancy cost | Revenue or output lost while the role sits open | $30,000 (45 days) |
| Team morale and attrition | Additional turnover triggered by the bad hire | Variable |
| Customer impact | Lost revenue, damaged relationships | Variable |
Add up recruiting spend
Direct recruiting costs include job board fees, agency or retained search fees, internal recruiter time, background checks, and assessment tools. Total recruiting spend for the req is your cost per hire for that role. An agency fee of 15% on a $120,000 role is $18,000 on its own.
Include salary and benefits paid during tenure
Include full compensation, not just base salary. Benefits made up 30% of employer compensation costs for private-industry workers in June 2026, according to the U.S. Bureau of Labor Statistics, which puts total compensation at roughly 1.4 times wages. At that multiplier, a $120,000 hire costs $168,000 a year, or $84,000 over six months. The example counts this full amount as a cost, so it leaves out a separate lost-productivity line to avoid counting the output gap twice.
Add onboarding and training costs
Onboarding and training costs include manager time, formal training programs, and equipment provisioning. You pay them again when the replacement starts. The example leaves the replacement’s onboarding out to keep the total conservative.
Add exit and severance costs
Exit costs include severance, accrued PTO payout, COBRA administration, exit interview time, and legal costs if the separation is contested. The example below uses $16,000 for a mid-level role. Senior roles with negotiated packages can run significantly higher.
Add the replacement cycle
The full recruiting cycle repeats: sourcing, screening, interviewing, and offer negotiation. The vacancy between the bad hire’s departure and the replacement’s start date adds lost output, overtime for the remaining team, and delayed projects.
Estimate the hidden costs
Estimate vacancy cost
Vacancy cost is daily revenue per employee multiplied by the number of days the role sits vacant. For revenue-generating roles, this is one of the largest hidden costs. For example, a sales rep carrying a $1.2 million annual quota represents roughly $4,600 per working day, so a vacancy of 60 working days (about three months) puts about $276,000 of quota at risk. For non-revenue roles, use productivity loss or project delay cost instead.
Price manager and team time
Managers and team members spend time interviewing, onboarding, and managing the bad hire. Multiply hours spent by the fully loaded hourly rate of everyone involved. For example, a hiring manager earning $180,000 a year has a fully loaded rate of around $121 per hour, so 17 hours of their time costs $2,057. That figure doesn’t yet include the three or four other panel members who sat in on interviews and debriefs.
Account for customer and revenue impact
Missed targets, lost customers, damaged client relationships, and quality issues all belong here. For customer-facing roles, one bad hire can cost more than their salary. For example, a customer success manager who loses two enterprise renewals at $150,000 each has cost the company $300,000 in revenue, regardless of what you paid them.
Factor in morale and follow-on attrition
A bad hire affects the people around them. Team morale drops, other employees start looking, the hiring manager loses credibility, and the TA function’s judgment gets questioned. If the bad hire triggers one additional departure, you face a second replacement cycle on top of the first.
Label the costs that are hard to measure
Cultural damage, reduced team trust, extra manager oversight, and the TA leader’s time managing the fallout still count, even when they’re hard to put a precise number on. Estimate them conservatively, label the assumptions clearly, and present them separately from the hard costs. A labeled estimate holds up better in a finance review than a vague figure or an inflated one.
Step-by-step bad hire cost calculator
Use this three-step calculator to build your own figure. Each step builds on the last.
Step 1: total the direct costs
List every direct cost of hiring, losing, and replacing this person:
- Agency or job board fees
- Internal recruiter time (hours x fully loaded rate)
- Background check and assessment costs
- Onboarding and training program costs
- Manager time spent on onboarding
- Salary and benefits paid during tenure
- Severance and exit costs
- Replacement recruiting costs (the same categories, estimated for the replacement hire)
Step 2: estimate the hidden layer
Estimate the costs that don’t appear in your accounting system:
- Lost productivity during ramp-up (skip this if Step 1 already counts the full salary paid as a loss)
- Manager and team time spent managing performance issues
- Vacancy cost after departure (daily revenue per employee x days vacant)
- Customer and revenue impact
- Follow-on attrition (one extra replacement cycle per departure)
Step 3: combine both layers
Add direct and hidden costs together. Expect the hidden layer to grow for senior, specialized, or customer-facing roles, where vacancy and customer impact costs run highest.
Worked example: a mid-level product manager
A mid-level product manager at a $120,000 base salary leaves after six months.
| Cost component | Direct cost | Hidden cost |
|---|---|---|
| Recruiting (agency at 15%) | $18,000 | x |
| Onboarding and training | $15,000 | x |
| Salary and benefits (6 months) | $84,000 | x |
| Severance and exit | $16,000 | x |
| Replacement recruiting | $18,000 | x |
| Manager and team time | x | $25,000 |
| Vacancy cost (45 days) | x | $30,000 |
| Total | $151,000 | $55,000 |
Total bad hire cost: $206,000, or about 1.7x annual salary. The line items are illustrative estimates. The example counts the full salary paid as a cost, so it doesn’t add a separate lost-productivity line, and it leaves out the replacement’s onboarding to stay conservative. Replace the figures with your own figures and keep the structure.
Every mis-hire prevented saves the full cost from your model. At $206,000, preventing one bad hire per quarter is worth $824,000 a year.
Where bad hires start: unstructured interview processes
Without a structured plan tied to role competencies, each interviewer asks different questions, covers different ground, and evaluates against different criteria. The debrief then compares candidates who were assessed on different dimensions.
Define evaluation criteria before the first interview
Scorecards tied to specific role competencies fix the consistency problem. Without them, interviewers fall back on gut feel and personal preference. Define the evaluation criteria during the intake meeting, before any candidate enters the process, so every interviewer assesses the same attributes using the same rubric.
Late feedback turns debriefs into recall exercises
When scorecards get submitted hours or days after the interview, the feedback reflects what the interviewer remembered walking out of the room. BrightHire’s AI scorecard auto-fill translates interview transcripts into pre-populated scorecards mapped to your evaluation criteria, which interviewers review before submitting. BrightHire customers submit feedback 28% faster.
Ground debriefs in evidence
Debriefs decided by whoever spoke loudest or interviewed most recently produce inconsistent outcomes. Grounding the debrief in recorded evidence and structured scorecards keeps the decision focused on candidate performance rather than panel dynamics. For a full framework on running structured debriefs, see BrightHire’s interview debrief guide.
Structured interviews predict job performance better
Schmidt and Hunter’s 1998 meta-analysis, published in Psychological Bulletin, aggregated 85 years of personnel selection research. It found an operational validity of .51 for structured interviews, among the highest of the 19 methods studied and well above the .38 for unstructured interviews. A 2022 meta-analysis by Sackett and colleagues found a wider gap, with structured interviews (.42) roughly twice as predictive of job performance as unstructured ones (.19). If your interviews are unstructured, Sackett’s estimates suggest they carry less than half the predictive validity of structured ones.
Standardize interviews to reduce bad hires
Build every interview from a competency plan
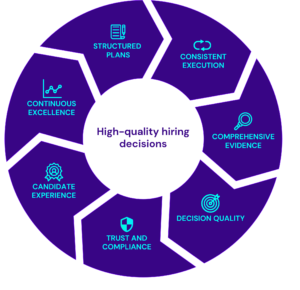
Structured hiring means every interview starts with a plan tied to competencies, uses consistent questions across candidates, applies a scoring rubric, and feeds into an evidence-based debrief.
Score every candidate against the same rubric
Consistent scorecards reduce the variance that comes from different interviewers evaluating different attributes. BrightHire’s interview scorecard template gives you a starting framework.
Replace notes with recorded evidence
Recorded interviews with highlight clips let the panel review exactly what the candidate said, instead of relying on whoever took the best notes. BrightHire customers run 27% fewer interviews per hire, and across a high-volume req load that interviewer time adds up.
“High-fidelity signal capture is the superpower. We haven’t really had access to it before, and the technology has finally caught up.” – Nicole Hirsch, Director, Recruiting at Horizon3.ai
Find where your interview process breaks down
Without a record of what each candidate said, the panel can’t check an impression against the answer that produced it. BrightHire’s structured interview framework and in-interview guidance keep interviewers working from consistent questions and criteria. Interview insights then help identify gaps in interviewer performance and opportunities for coaching before those issues affect hiring decisions.
Connect interview data to quality of hire
Beyond improving individual interviews, this data can help teams understand how interview practices relate to hiring outcomes over time. By comparing interview-level insights with post-hire performance and retention data, teams can identify which practices are associated with stronger hires. For the full framework, see BrightHire’s quality of hire guide and its guide to building a quality of hire system that gets smarter over time.
BrightHire holds a 4.7 out of 5 on G2 across 182 reviews, with customer support rated 9.8 out of 10. Teams at LinkedIn, SoFi, HCA Healthcare, and Gartner use BrightHire to run structured, evidence-based interviews at scale.
“BrightHire reduces the burden of manual note-taking, keeps interviews structured and consistent through standardized attributes, scorecards, and AI-supported notes, and improves fairness by grounding hiring decisions in documented insights rather than memory or personal bias.” – Divya Bharathi D. on G2
Request a demo to see how BrightHire syncs with your ATS and what an AI-generated scorecard looks like in your candidate record.
FAQs
There’s no reliable single average. Gallup puts the cost of replacing an individual employee at one-half to two times annual salary, and a bad hire adds the original hire’s costs on top. The example in this article comes to $206,000 for a $120,000 role. For a finance-ready figure, run the formula with your own data.
There’s no fixed timeline. It depends on the role and how closely early performance is tracked. The cost accrues the entire time, which is why structured onboarding reviews and probationary checkpoints matter.
Yes. Structured interviews with recorded evidence and AI-generated scorecards help speed up debriefs and reduce total interviews per hire.
Structured interviews with consistent questions and scoring rubrics are among the strongest predictors of job performance. Validity estimates range from .42 (Sackett and colleagues, 2022) to .51 (Schmidt and Hunter, 1998). Questions tied to specific role competencies give the panel evidence it can compare across candidates.
Quality of hire combines performance ratings, retention, ramp time, and hiring manager satisfaction. Structured interview data provides the baseline for measuring whether your process is improving over time.
Key terms glossary
Bad hire: An employee who leaves or is let go within the first year because the role wasn’t a fit, or who underperforms against role expectations to the point of requiring replacement or formal performance management.
Direct costs: Recruiting fees, salary and benefits paid, onboarding and training, severance, and replacement recruiting costs. These are the hard costs visible in your accounting system.
Hidden costs: Lost productivity, manager and team time, vacancy cost, missed targets, morale impact, customer impact, and attrition triggered by the bad hire. These require estimation, but they still belong in the total.
Quality of hire: An outcome-based measure of hiring success, typically combining performance ratings, retention, ramp time, and hiring manager satisfaction.
Interview intelligence: Technology that uses AI to capture, structure, and analyze interviews, generating notes and scorecards that support human hiring decisions and surfacing coaching insights for process improvement.